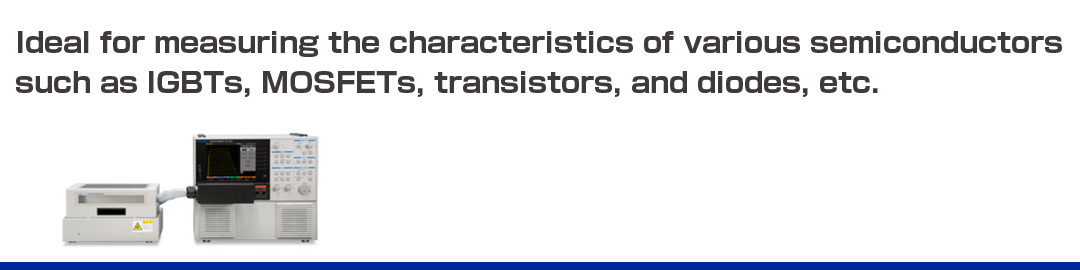
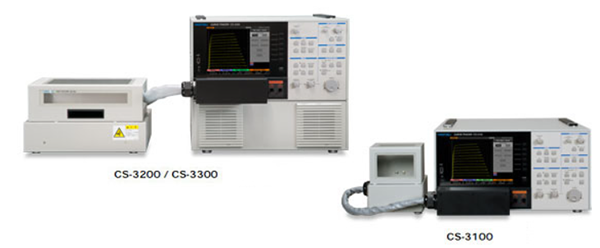
CS-3000 Series
- Maximum peak voltage 3,000V (high voltage mode)
- Maximum peak current 1,000A (CS-3300 high current mode)
- All models equipped with LEAKAGE mode (1pA cursor resolution)
- USB port to save screen data and setup data
- Equipped with LAN interface for remote control
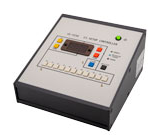
Easy-to-understand measurement screen
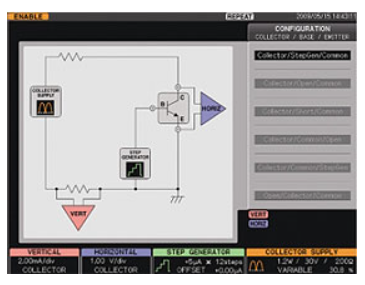
Configuration screen
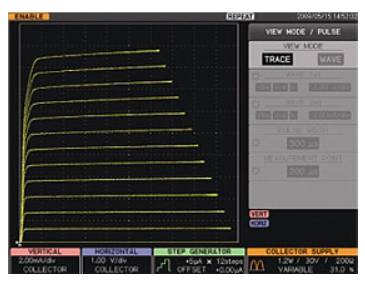
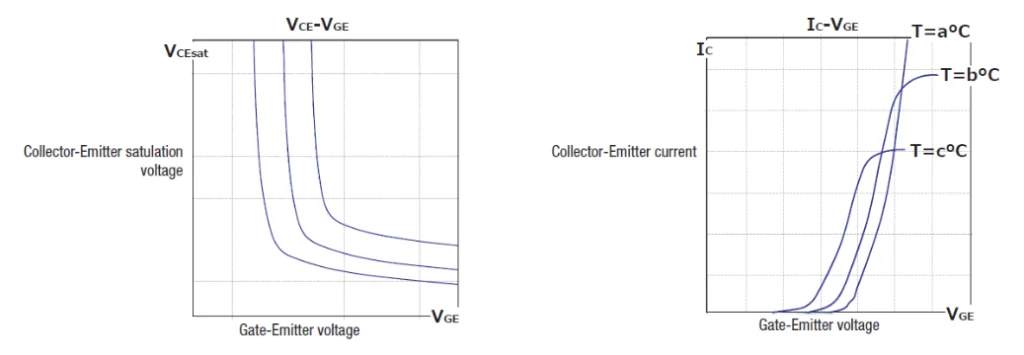
Example of V-I characteristics of transistor (TRACE mode)
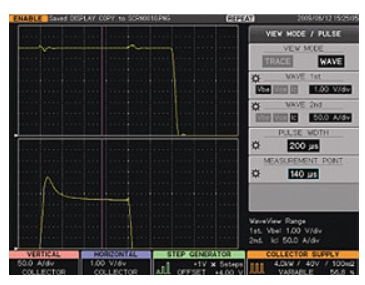
Vbe/lc waveform in high current pulse mode (WAVE mode)
- Collector supply HV mode Specifications
- Collector supply HC mode Specifications
- Common Specifications
- Standard Accessories
- Options
Specifications
Collector supply HV mode Specifications
| Model | CS-3100 / CS-3100-300V * 2 | CS-3100 / CS-3200 / CS-3300 | |||
|---|---|---|---|---|---|
| Mode/polarity | Full wave rectification/ + – , DC/ + – , LEAKAGE/ + – , AC | ||||
| Maximum peak voltage | 300V | 30V | 3kV | 300V | 30V |
| Maximum peak current (maximum peak pulse current * 1 ) | 750mA (1.5A * 1 ) | 7.5A (15A * 1 ) | 75mA (150mA * 1 ) | 750mA (1.5A * 1 ) | 7.5A (15A * 1 ) |
| Maximum peak power | 120mW / 1.2W / 120W / 390W (Cannot be set when using the maximum peak voltage of 3kV) | ||||
| Horizontal axis range | 50mV~500V/div | ||||
- The maximum instantaneous current value that can be generated (varies depending on the target to be measured and conditions) measurement should be less than or equal to the maximum peak current value.
Collector supply HC mode Specifications
| Model | CS-3100 / CS-3100-300V * 2 | CS-3200 | CS-3300 | |||
|---|---|---|---|---|---|---|
| Mode/polarity | Not equipped with HC mode | Pulse/ + – | ||||
| Maximum peak voltage | 40V | |||||
| Maximum peak current | 400A | 40A | 1,000A | 400A | 40A | |
| Maximum peak power | 4kW | 400W | 10kW | 4kW | 400W | |
| Pulse width | Pulse width is variable at 50µs to 400µs (10µs resolution) | |||||
| Measurement point | The measurement point can be specified (10µs resolution) | |||||
| Vertical axis range | 100mA~50A/div | 100mA~100A/div | ||||
| Test fixture | CS-301 | CS-302 | ||||
Common Specifications
| Model | Contents | ||
|---|---|---|---|
| Loop correction | Hardware | Correction of floating capacitance between collector supply and ground | |
| Software | Pseudo-looping through software optimization | ||
| Step generator | Offset | Setting range | -10 ~ +10 x STEP AMPLITUDE Setting |
| Resolution | 1% of STEP AMPLITUDE setting | ||
| Current mode | Range | 50nA to 200mA per step, 21 steps 1-2-5 switching | |
| Maximum current | 2A | ||
| Maximum voltage | 10V or more | ||
| Voltage mode | Range | 50mV to 2V per step, 6 steps 1-2-5 switching | |
| Maximum current | 500mA~(~8V), 200mA~(~15V), 10mA~(~40V) | ||
| Maximum voltage | ±40V | ||
| Step rate | 2x 50Hz or 60Hz (1x in AC mode), pulse interval in HC mode | ||
| Pulse step | Pulse width | 50µs~400µs (10µs step) When in HC mode, the pulse width is 100µs wide before and after the pulse of the collector supply | |
| Number of steps | 0~20 Step | ||
| AUX output | Range | OFF, -40V~+40V (Variable in 100mV steps) | |
| Measurement mode | REPEAT、STOP / SINGLE、SWEEP | ||
| Vertical axis (full scale 10div) | Collector current | Range | HV mode:1µA/div to 2A/div, 20 steps 1-2-5 switching (HC mode is not included) |
| Accuracy | 2% + 0.05 x VERT/div of readout To this, add the loop correction error for the following maximum peak voltages 0.5µA(30V), 1µA(300V), 6µA(3kV), 12µA(5kV) Specify at least 10% of the maximum peak voltage for 30V, 300V, and 3kV, and at least 30% for 5kV | ||
| Emitter current (LEAKAGE) | Range | 1nA/div~2mA/div, 20 step 1-2-5 switching (Collector supply mode is LEAKAGE) | |
| Accuracy | 2% + 0.05 x VERT/div + 1nA or less of readout | ||
| Horizontal axis (full scale 10div) | Collector voltage | Range | HC mode:50mV/div to 5V/div, 7 steps 1-2-5 switching (HV mode is not included) |
| Accuracy | 2% + 0.05 x HORIZ/div or less of readout | ||
| Base/ emitter voltage | Range | 50mV/div~5V/div, 7 step 1-2-5 switching | |
| Accuracy | 2% + 0.05 x HORIZ/div or less of readout | ||
| Display | Display | 8.4-inch TFT LCD | |
| Number of data points | 1,000 points/trace (AC, full wave rectification) 20~1,000 points/trace (SWEEP mode) | ||
| Trace display | Point interpolation display, dot display | ||
| Averaging | OFF, 2 to 255 times | ||
| Persistence | OFF, SHORT, LONG, Infinite length | ||
| Save internal waveform (REF) | 4-Panel | ||
| Cursor | DOT | Vert, Horiz, β or gm | |
| fLINE | Vert, Horiz, 1/grad, intercept | ||
| FREE | Vert, Horiz, β or gm | ||
| WINDOW | Vert, Horiz, β or gm in the WINDOW area | ||
| Data save/read | Memory | Setup:256 pcs, REF:4 screens | |
| External memory | USB1.1:Setup, waveform, screen hardcopy (BMP, TIFF, PNG) | ||
| Remote | Equipped with remote 10BASE-T/100BASE-TX 1 port via LAN connection | ||
| Power supply | AC100~240V 50/60Hz, Maximum operating power:500VA (400W), Standby:50VA (7W) | ||
| External dimensions(mm) Weight | CS-3100 / CS-3100-300V * 2 | Approx. 424W x 220H x 555D (excluding protrusions and accessories) approx. 28kg (excluding accessories) | |
| CS-3200、3300 | Approx. 424W x 354H x 555D (excluding protrusions and accessories) approx. 43kg (excluding accessories) | ||
- CS-3100-300V is a made-to-order product.
Standard Accessories
| CS-3100 Standard Accessories | ||
|---|---|---|
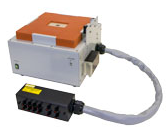
 CS-301 Fixture S |  CS-500 Test adapter | 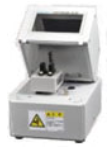 Mounted image * CS-501A is optional. |
| CS-3200 / CS-3300 Standard Accessories | ||
|---|---|---|
 CS-302 Fixture M | 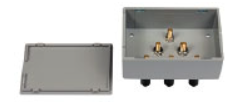 CS-500 Test adapter |  Without Patch Panel |
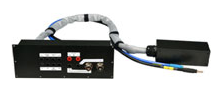
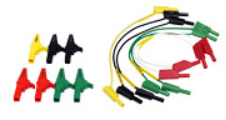 Wire set | ||
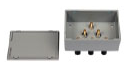
| CS-500 Test adapter | |
|---|---|
| This is a jig for connecting the part to be measured provided by the customer and the fixture. (Standard accessories) |
Options
CS-301
CS-302
Test fixture S
Standard with CS-3100 main unit
Test fixture M
CS-3200 CS-3300 Standard with each main unit
CS-303
CS-304
Test fixture M
CS-5100 / CS-5200 / CS-5300 Standard with each main unit
Test fixture M
Standard with CS-5400 main unit
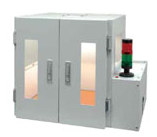
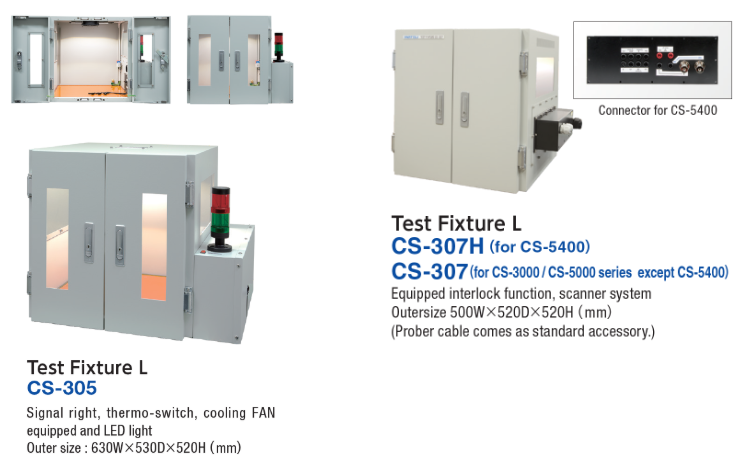
CS-305
CS-307 / CS-307H
Test fixture L
Signal light, thermo switch, cooling fan, equipped with LED light, interlock
テスト・フィクスチャ
CS-307 :For CS-3000/CS-5000 (excluding CS-5400)
CS-307H : For CS-5400
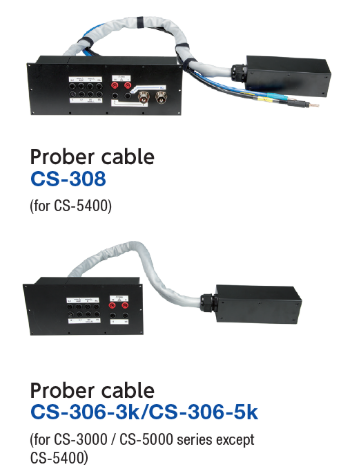
CS-306
CS-308
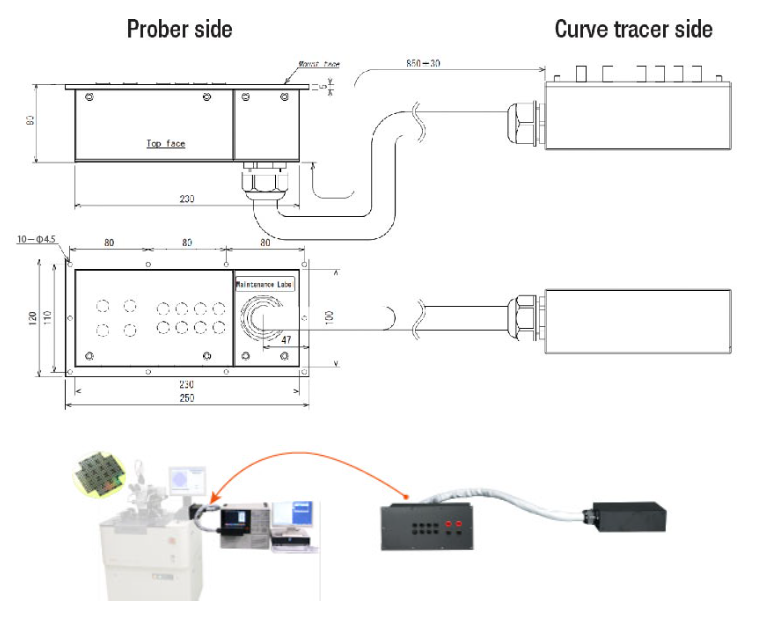
Prober cable
For CS-3000/CS-5000 (excluding CS-5400)
Prober cable
For CS-5400
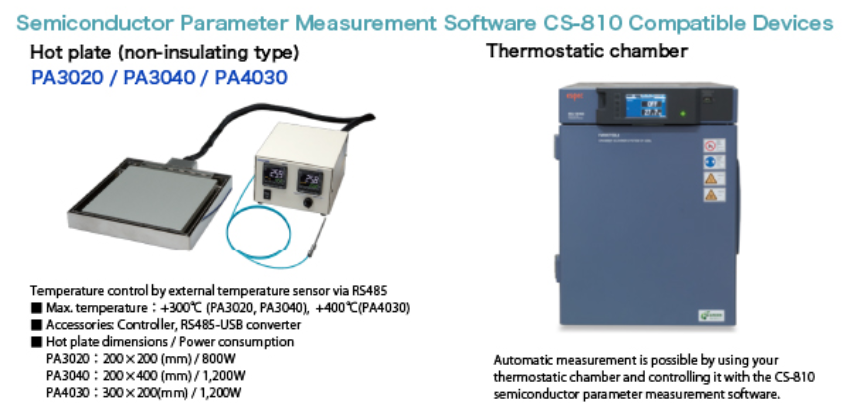
PA-3020 / 3040 / 4030
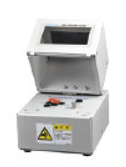
CS-310
Hot plate
Non-isolated type
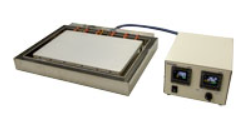
Test fixture for thermal streamer
CS-521 / CS-522 / CS-523
IE-1310
Adapter for thermal streamer
Supported package:
CS-521 :TO (CS-501A heat-resistant support))
CS-522 : TO-263-3 (D2PAK)
(CS-503 heat resistant)
CS-523 : TO-252-3 (CS-504 heat-resistant support)
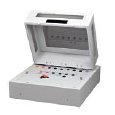
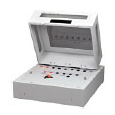
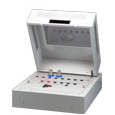
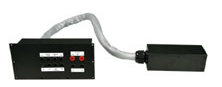
CS setup controller
Ideal for production lines because the settings can be switched without any menu operation on the main unit.
Test adapter option
CS-500
Heat resistant TO socket
Test adapter (1 standard with main unit)
200℃, 350A(500μs)
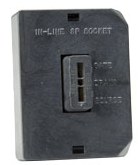
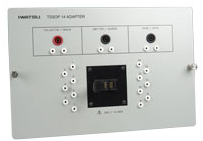
For TSSOP14
CS-501A
*Test fixture CS-301 cannot be used
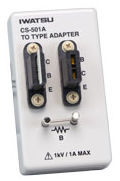
TO type test adapter
This is a socket suitable for TO type packages (3 terminals).
It can be used with lead spacing from 1.52mm to 4.57mm.
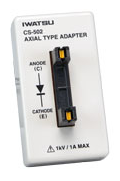
CS-502
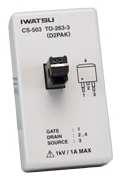
CS-503
AXIAL type adapter
1kV / 1A MAX
TO-263-3 (D2APK) type adapter
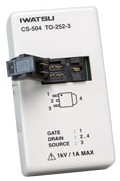
CS-504
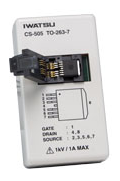
CS-505
TO-252-3 type adapter
TO-263-7 type adapter
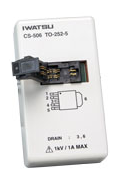
CS-506
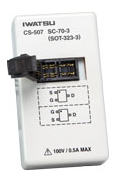
CS-507
TO-252-5 type adapter
SC-70-3 (SOT-323-3) type adapter
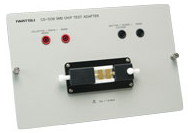
CS-508
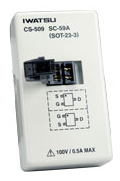
CS-509
SMD tip type adapter
SC-59A (SOT-23-3) type adapter
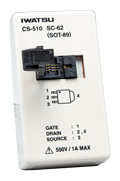
CS-510
SC-62 (SOT-89) type adapter
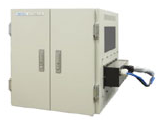
CS-700 Series options
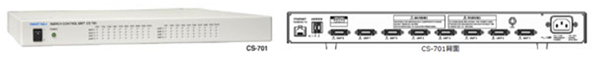
CS-701
CS-702A
Switch control module
It is an indispensable unit that collectively controls each unit from the semiconductor parameter measurement software CS-810 by connecting it with a PC by Ethernet.
One unit can control up to 8 units. By assigning an IP address, parallel operation using multiple units (up to 10 units) is also possible.
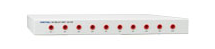
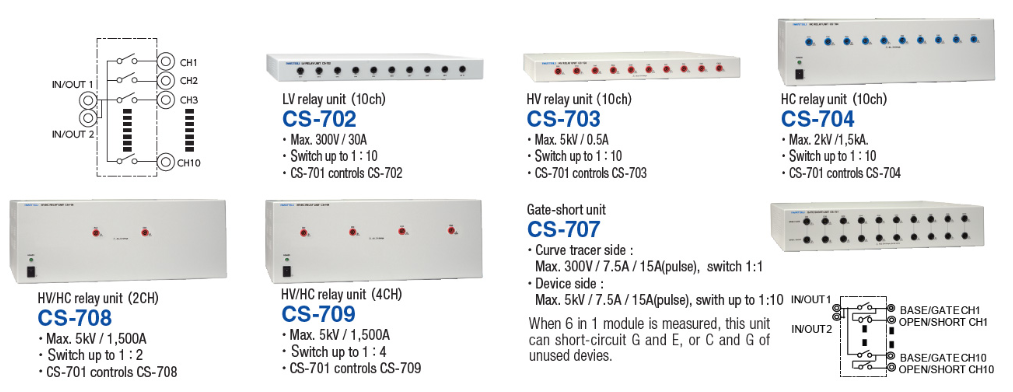
LV relay unit
300V/7.5A/30A(Pulse) 10CH
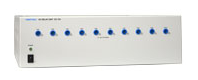
CS-703A
CS-704A
HV relay unit
5kV/0.5A 10CH
HC relay unit
2kV/7.5A/1,500A(Pulse) 10CH
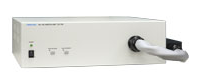
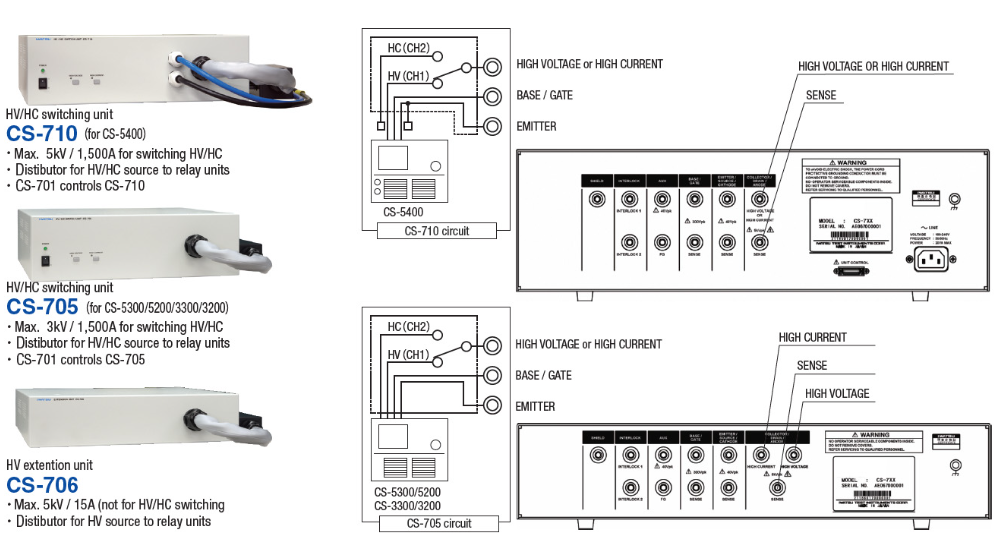
CS-705
CS-706
HV/HC switch unit
With 5kV/1,000A (Pulse) HV/HC switching (manual) function for CS-3200/3300/5200/5300
Extension unit
If you wish to use 5kV/1,000A (Pulse) CS-5400, you will need to modify it
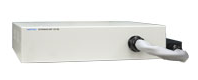
CS-707
CS-708
Gate/short unit
It is possible to shorten the G-E or C-G intervals of elements that are not being measured during measurement of a 6 in 1 module.
Curve tracer side: 300V/7.5A/15A (Pulse) Device side: 5kV/7.5A/15A(Pulse) 10CH
HV-HC relay unit
5kV/7.5A/1,500A(Pulse) 2CH
CS-709
CS-710
HV-HC relay unit
5kV/7.5A/1,500A(Pulse) 4CH
HV/HC switch unit
With 5kV/1,500A (Pulse) HV/HC switching (manual) function for CS-5400
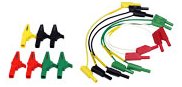
Cable Options
CS-001 (red 10 pcs)
CS-002 (black 10 pcs)
Small crocodile clip
This is a small crocodile clip that can be attached to a wire set.
Small crocodile clip
This is a small crocodile clip that can be attached to a wire set.
CS-003
CS-004
High voltage wire red 5 pcs set
Wire black 5 pcs set
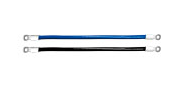
CS-005
CS-006
Standard lead set
This is a lead set that comes as a standard accessory with the main unit.
Cables for high current 20cm x 2 sets
Standard accessory with the CS-5400 main unit
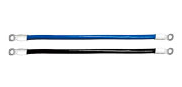
CS-007
Cables for high current 30cm x 2 sets
Standard accessory with the CS-10400 or CS-10800 main unit
Software
CS-800
CS-801
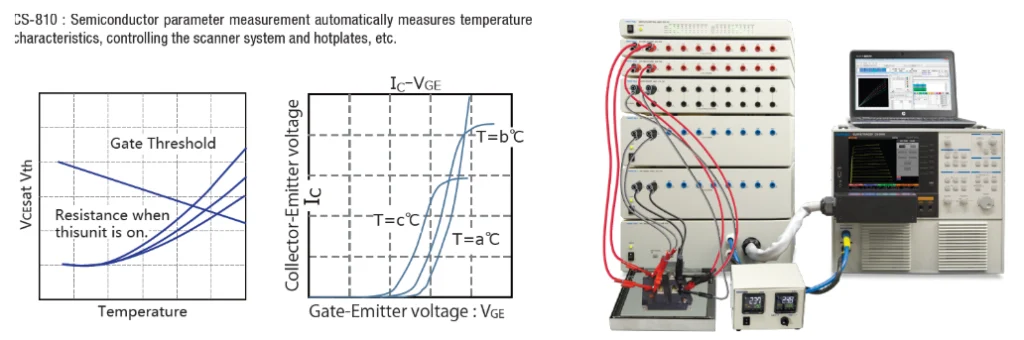
CS-810
Semiconductor parameter search body software
Software option to be integrated and used in the main unit.
Embedded Software
Double sweep
Software option to be integrated and used in the main unit.
Embedded Software
Semiconductor parameter measurement PC software
This is the software used on the PC (sold separately) when the SC-800 is installed on the main unit.
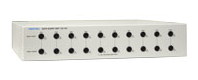
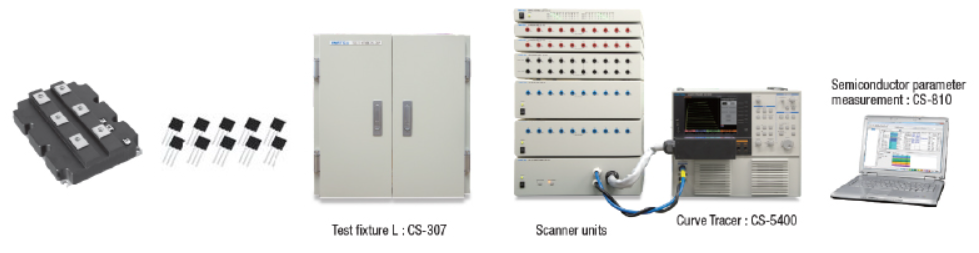
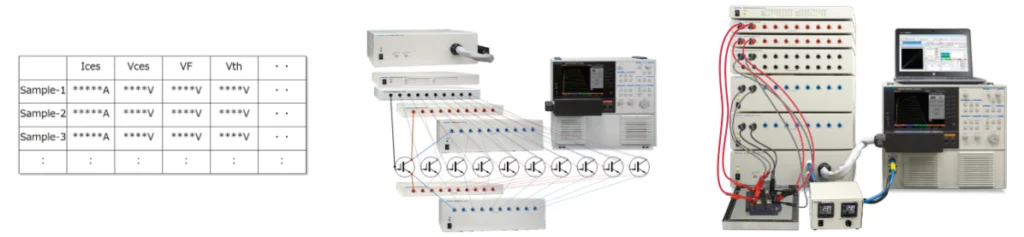
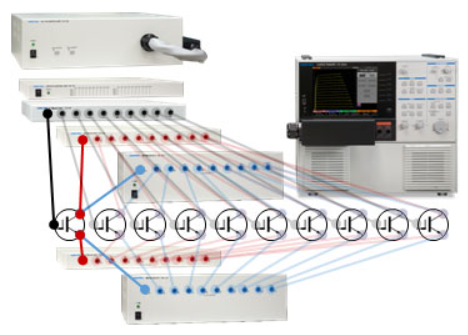
Scanner system
Automates the switching of each chip and multiple devices, such as 6 in 1 (7 in 1) and 2 in 1 modules.
Control each relay unit with the semiconductor parameter measurement CS-810 (installed on the external PC) to automate the connection switching of the terminals.
By controlling the main unit, the relay unit, the thermostat tank, and the hot plate, the CS-810 can also automatically measure the temperature characteristics of each chip of 6 in 1 modules.
The relay unit can be connected in parallel. Up to 10 units (100ch) are possible.
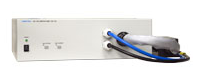
Switch control module
It is an indispensable unit that collectively controls each unit from the semiconductor parameter measurement software CS-810 by connecting it with a PC by Ethernet.
One unit can control up to 8 units. By assigning an IP address, parallel operation using multiple units (up to 10 units) is also possible.
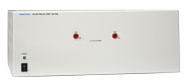
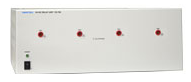
Relay unit
Extension unit
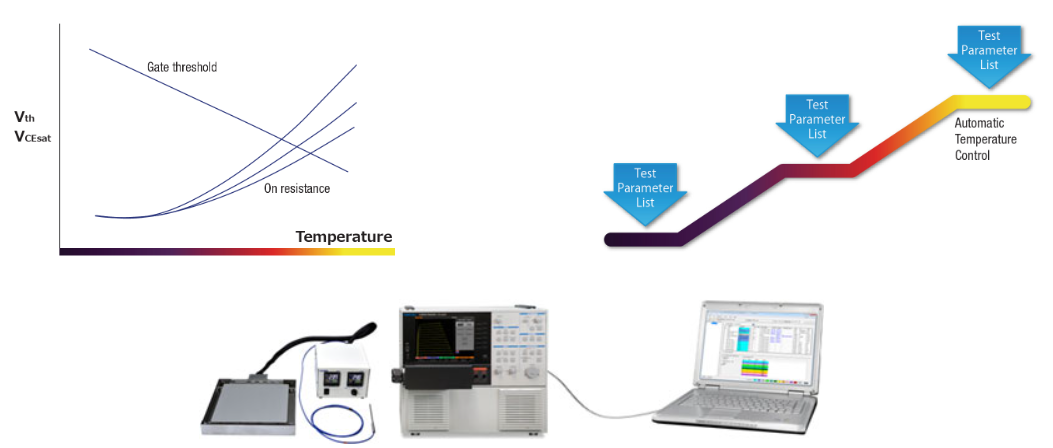
Temperature characteristics measurement
Labor-saving temperature characterization test
By automatically controlling the curve tracer, scanner system, and hot plate from the semiconductor parameter measurement software CS-810, it is possible to reduce the time required for temperature characterization.
Hot plate/thermostatic chamber
Accessories
Prober cable
Test fixture L
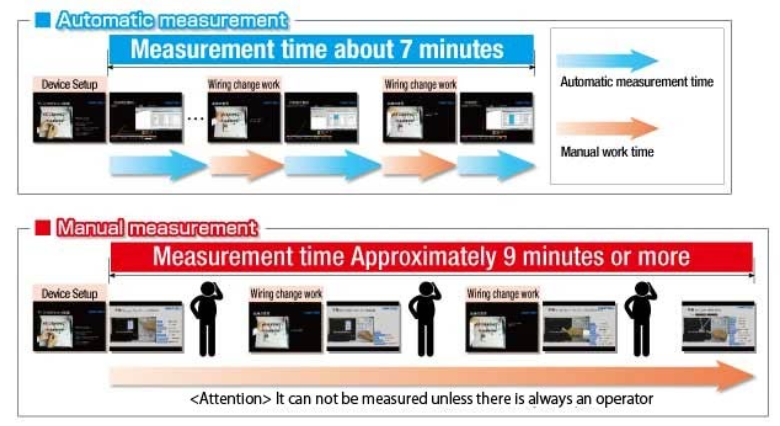
Automate measurement and improve efficiency!
In the past, many items had to be set manually, meaning that measurements took a long time, but by adopting the , it is possible to easily automate measurements, and furthermore, the measurement details can be saved as evidence. In addition, automatic judgment is also possible by setting the threshold value in advance.
Advantages of adoption
- Make accurate and reliable measurements according to the measurement procedure
- Measurement content is also saved as evidence
- Auto-judgment is also possible
- Control of optional products can also be automated (e.g. temperature control of hot plate)
We made an actual comparison (IWATSU comparison)
A comparison was made between automatic measurement (Semiconductor Parameter Measurement Software CS-810) and conventional manual measurement using the same sample.
- For the time of manual measurement, it was assumed that an experienced operator performs the measurement.
Video of automated measurement using "Semiconductor Parameter Measurement Software CS-810"
動画を入れる??
Video showing the large amount of time it takes to measure when configuring settings manually (it takes a long time, so 2x speed playback is used)
動画を入れる??
You can also automate “wiring change work.” Scanner System CS-700 Click here for more information
Capable of controlling peripheral devices.
A software option that you install on your PC to control curve tracers, scanners, hotplates, etc. via Ethernet.
The easy setup improves work efficiency by automating measurements with a curve tracer that previously only allowed manual measurements.
Automate measurement, recording, and judgment to improve efficiency of manual sorting and inspection.
Measure modules and multiple discrete devices while automatically switching between them.
Simultaneous control of the main unit, scanner, and hot plate, as well as fully automatic measurement of the temperature characteristics of the 6-in-1 module.
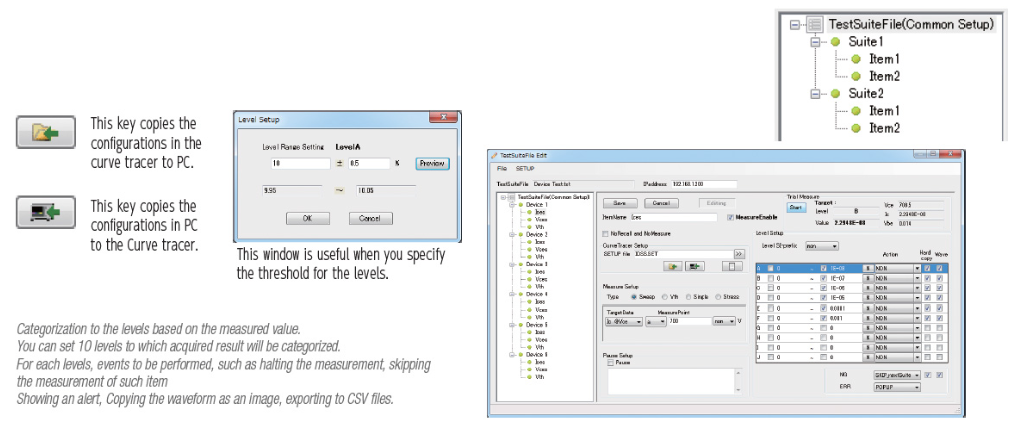
No programming knowledge required
By loading the settings of the curve tracer measured manually into the PC, the sequence is set, so no knowledge of programming is required, and anyone can easily set it.
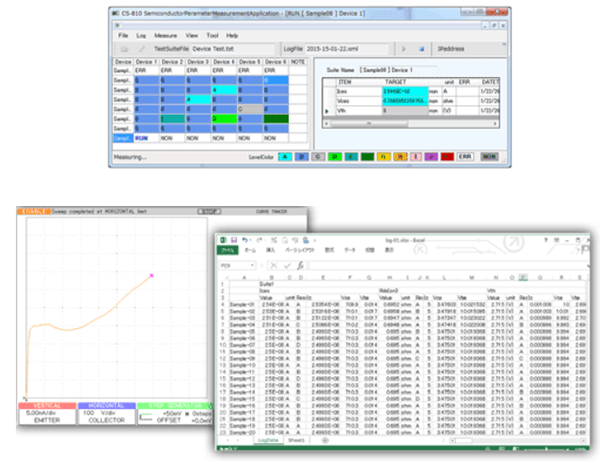
Automatic measurement (leakage current, saturation voltage, VF, Vth, etc.)
Measurement results window
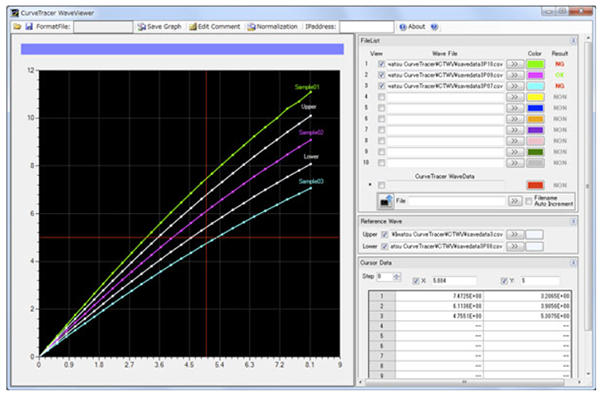
Waveform comparison function
You can compare a large number of waveforms that have been saved after measurement, such as development variation and defect analysis. In addition, you can also judge the quality by comparing the waveforms.
■Waveform comparison
and judgment
You can judge the quality by comparing the waveform to the reference data.
■Waveform display
CSV files and curve tracer recalled waveforms acquired in the past and currently acquired waveforms can be simultaneously displayed and compared on the same graph with a maximum of 10 waveforms.
■Rescaling function
Saves the displayed waveform voltage axis to a CSV file at any interval. When the measurement results are displayed in a table, the voltage axes can be aligned.
■Cursor functions
Displays the values of the displayed waveform in a list. In addition, the values are displayed by interpolation for points other than the sampling points.
■Comment
You can view, edit, and move comments on each waveform.
■Save graph image
You can save any combination of graph, file list, and cursor values to an image file.
(Image format:PNG/BMP/JPG/TIFF)
■Colorful graph display
--Settable items --
Graph title, plot area background color, cursor color, Line Dot (line only, dot only, line and dot) X-axis, Y-axis: axis title, data selection (Ic/Vce/Vbe), scale (Log/Linear) (Y-axis only), scale interval (Auto ,1-2-5 Step), scale minimum, maximum, grid (display color, hidden)
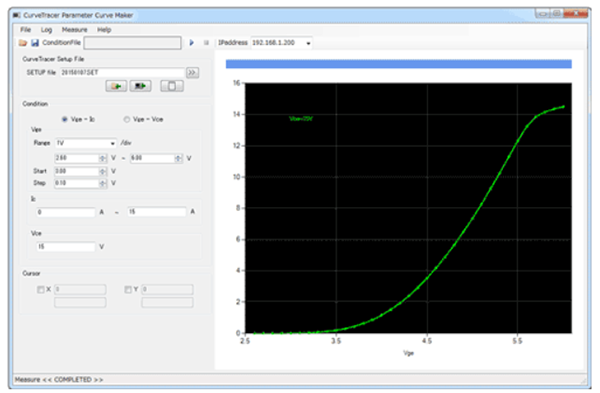
Automated measurement of transmission characteristics
You can automatically measure transmission characteristics with a curve tracer.
Save characteristic curve to file
The measured characteristics are saved in a CSV file, and the graph is saved as image data in a file.
*Image format:PNG/BMP/JPG/TIFF
Cursor functions
Displays the cursor on the X- and Y-axes. The values are displayed by interpolating between the measurement data points.
Graph area customization
You can customize the graph title, axis label, background color, axis range, etc.
Saving and reading settings
You can save the settings of the characteristic measurement and the customization settings of the graph area to a file and call them.
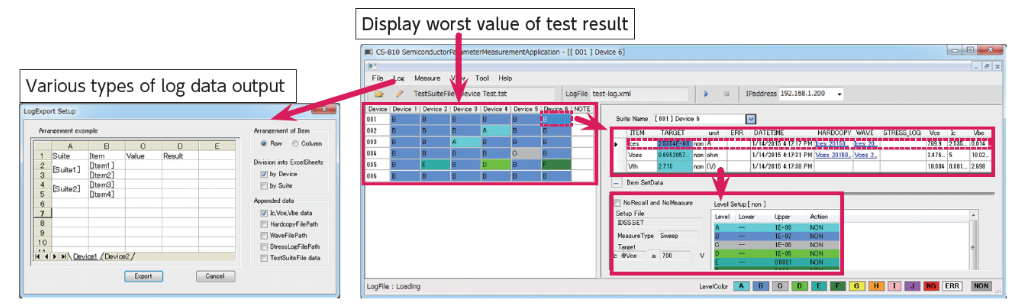
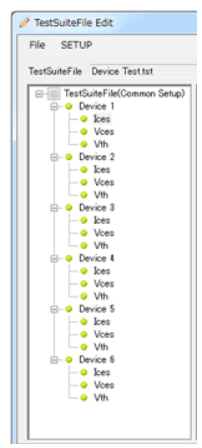
Device testing
Multiple device tests and records can be reliably performed in a short time.
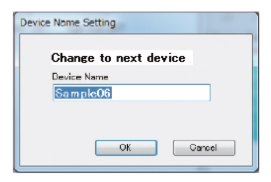
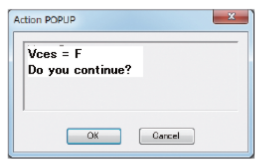
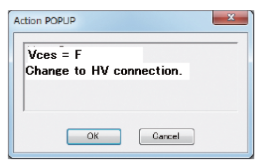
Automatically executes multiple measurement items.
The operator can repeat the measurement under the same conditions by replacing the device, replacing the wiring, or entering the sample name if necessary (with the sample name automatic increment function) according to the information in the pop-up.
The judgment result is displayed for each measurement, and the image and waveform data are automatically saved.
Waveform images and data are automatically saved during measurements.
The stress test logs are saved to a separate file.
You can also select the measurement result from the log display screen and rerun the measurement.
Module measurement
The scanner system is controlled simultaneously with the curve tracer.
You can also control the opening/shorting and HV/HC switching of each element gate, realizing fully automatic measurement of one module without removing the bus bar.
After setting one element, the setting of CS-810 can be easily created by copying the number of elements.
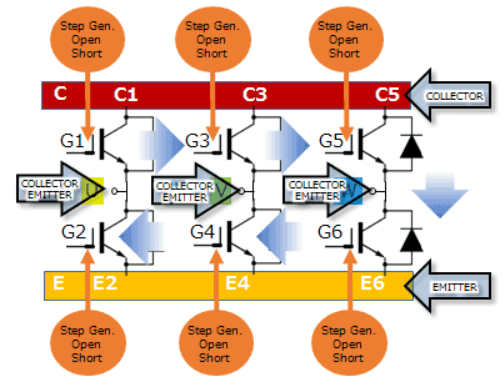
- 測定していない素子のゲートはエミッタとショートすることが出来ます(CS-707)
Save characteristic curve to file
The measured characteristics are saved in a CSV file, and the graph is saved as image data in a file.
- Image format:PNG/BMP/JPG/TIFF
Cursor functions
Displays the cursor on the X- and Y-axes. The values are displayed by interpolating between the measurement data points.
Graph area customization
You can customize the graph title, axis label, background color, axis range, etc.
Saving and reading settings
YYou can save the settings of the characteristic measurement and the customization settings of the graph area to a file and call them.
Temperature characterization of semiconductors
The CS-810 also controls the hot plate at the same time.
Time-consuming measurement of parameters for each temperature can also be fully automated.
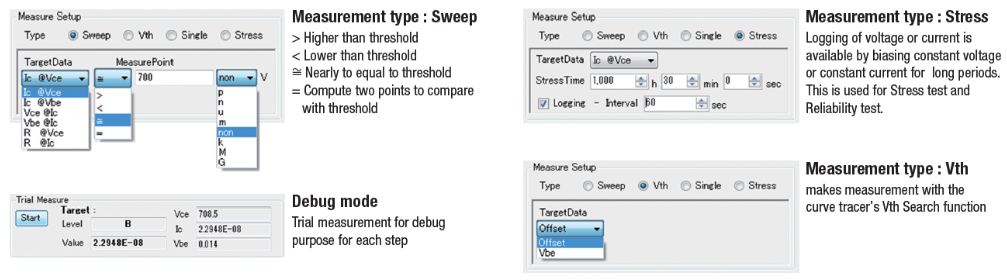
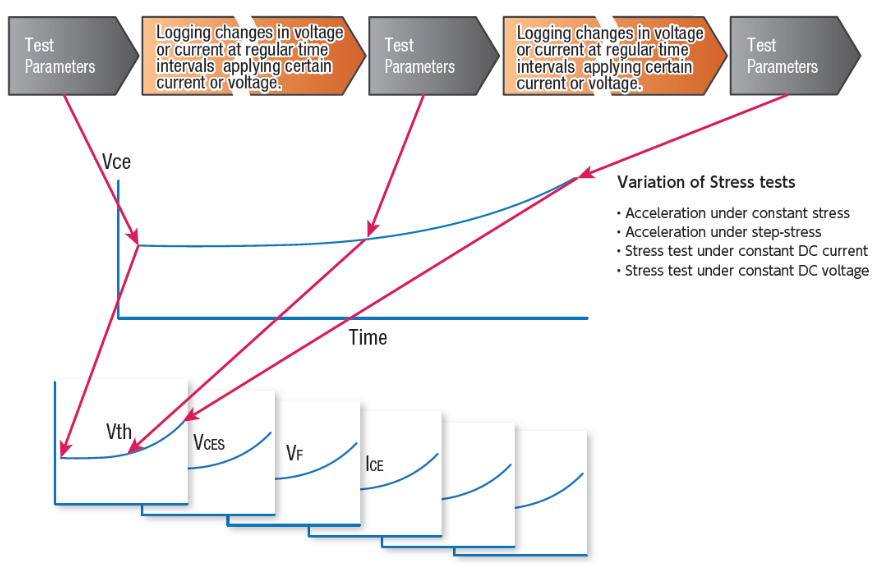
Stress testing
Various parameters can be incorporated into stress testing
- Long-term reliability testing is possible.
- Current and voltage are automatically monitored by the curve tracer side at all times, and current and voltage changes are logged.
- Various parameters can be automatically measured during and before and after the stress test.
- Set the lower and upper limits for both current and voltage, and stop the application when the limit is exceeded.
Hold a constant voltage or current (10 seconds to 1,000 hours)
Measure Ic and Vce (interval: 10 seconds to 2 hours)
Discrete device testing
Connect to measure multiple devices with one click
The same elements can be measured sequentially. The scanner system CS-700 series has 10CH. Fully automatic measurement of 10 elements, such as time-consuming temperature characteristics. The setting of the control software CS-810 is also completed when one element is copied.
Response to wafer measurement
Measure device on wafer by coupling with probe system
- Prober cableCS-306/308
- Cable for connecting the probe to the curve tracer (equipped with an interlock terminal)